Political Climate & Crime Presence
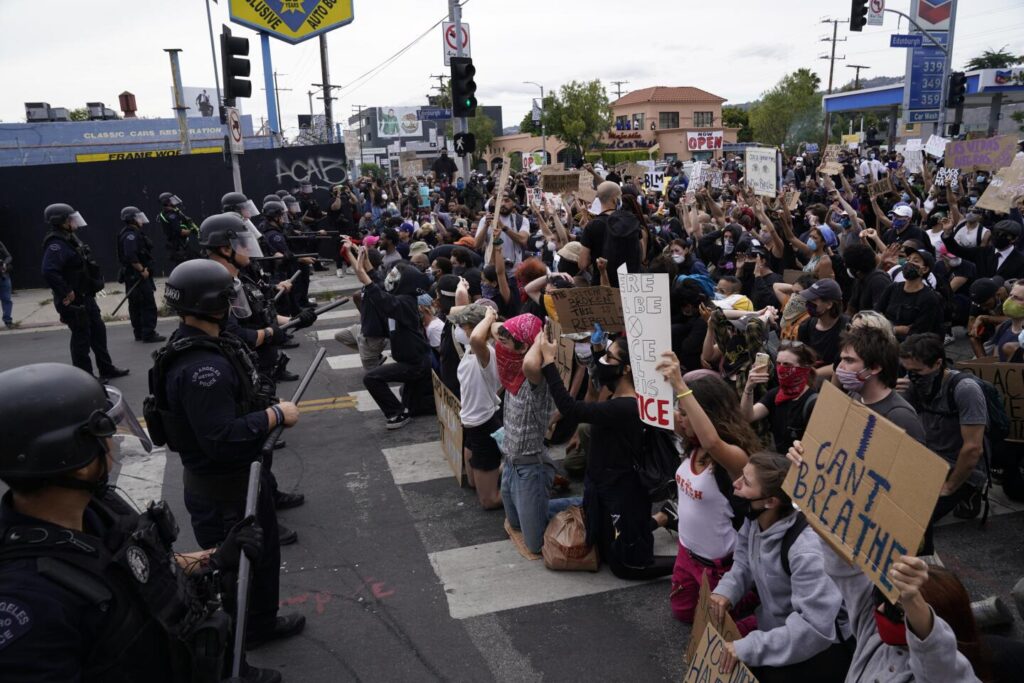
Black Lives Matter Protest in Pan Pacific Park, Los Angeles. Original photograph taken by Kent Nishimura with the LA Times. Image accessed through Medium.
Introduction: Our Narrative’s “Booking”
Crime statistics in major cities are shaped not only by criminal behavior but also by political conditions, institutional policies, and public trust in law enforcement. From 2021 to 2025, Los Angeles looks very different, experiencing significant social and political change, with crime at its center. How it occurred, was reported, and overall understood by Los Angelenos. The city, still recovering from the COVID-19 pandemic, emerged into discourse on navigating what’s next. Political tensions on policing, criminal justice reform, and the upcoming 2024 presidential elections were rampant. Public protests and debates about police accountability persisted following the national demonstrations following George Floyd’s murder in 2020. At the same time, the Los Angeles Police Department introduced a new data collection and record-keeping system, affecting how all crimes were categorized and documented.
To understand crime trends during this time, we must look beyond raw report counts. These statistics are produced by political issues, institutional practices, and demographic inequalities that change trends as much as changes in criminal activity itself. This report examines how crime victimization patterns in Los Angeles changed between 2021 and 2025, focusing on shifts in crime severity, crime categories, and geographic distribution. From our analysis, we argue that changes in reported crime in Los Angeles reflect the intersection of political climate, policing practices, and structural inequalities across the city, rather than simply fluctuations in individual criminal behavior.
Offense 1: Crime Severity & Reporting Practices
To examine the severity of crime over time, we analyzed the distribution of non-violent and violent crimes in Los Angeles in 2021 and 2025. Violent crimes would include offenses such as assault, homicide, and robbery, while non-violent crimes would include property crime, fraud, and those without direct physical harm. Calculating the proportion of each category in both years was vital to reveal the composition of reported crime and how it shifted.

Figure 1: Proportion of Reported Crimes by Severity (Non-violent vs. Violent) in 2021 and 2025
Figure 1 illustrates a notable change in the distribution of crime severity. 2021 shows violent crimes accounting for about 59.42% of reported incidents, while non-violent crimes represent 40.6% of the total crime reported. However, by 2025, this pattern is completely reversed. Non-violent crime makes up 76.68% of reported incidents, while violent crimes declined to merely 23.3%.
With such a drastic shift, it calls into question the shift in the structure of reported crime in Los Angeles and if this trend is truly accurate of a criminal behavior shift. One potential explanation lies in changes in law enforcement reporting systems. During the early 2020s, police departments across the country began transitioning toward the National Incident-Based Reporting System (NIBRS). The previous Summary UCR system only recorded the most serious crimes, which left many completely ignored and with many holes in their records, including the victim’s additional charges or circumstances around the situation. This NIBRS system aimed to collect more detailed information about criminal incidents, including multiple offenses within a single event. As a result, lower-severity crimes that previously would have been overlooked are more likely to be documented in official records (Strom & Smith, 2017). Additionally, the political conditions may have also influenced how crimes were reported or categorized. In the wake of nationwide protests for police reform, law enforcement faced pressure to improve transparency and accountability in reporting. This demand for expanded documentation may therefore have contributed similarly to the increase in recorded non-violent crimes in 2025, shown in Figure 1.
Overall, while the data suggests a decrease in violent crime, the change is likely less due to a simple decrease in violent behavior and rather reflected a combination of institutional reporting changes and police priorities.
Offense 2: Geographic Patterns

Figure 2: Spatial distribution of Reported Crimes in Los Angeles in 2021 and 2025
Crime rarely affects people evenly, but particularly throughout Los Angeles. Incidents tend to cluster in specific neighborhoods shaped by population density, economic conditions and urban infrastructure. Using a geographic heat map showing the convention of reported crime incidences across L.A. we aimed to examine these spatial patterns.
Figure 2 visualizes this distribution with darker red areas indicating a higher concentration of reported crime incidences. High concentrations occur primarily in central Los Angeles, with other clusters extending south towards Inglewood and Compton.
These geographic patterns reflect the longstanding structural inequalities present in Los Angeles. Research by criminologists John Hipp and Charis Kurbin, studying neighborhood crime patterns in L.A., found that crime was often linked to broader patterns of inequality across the city. The research demonstrated that neighborhoods with growing economic inequality and changing racial and ethnic competition tended to experience higher crime rates over time. This finding showed that crime in Los Angeles was not just influenced by what happened within a single neighborhood, but also by the larger social and economic dynamics of the surrounding communities (Hipp & Kurbin, 2017). This perspective helps explain why crime clusters appear across adjacent neighborhoods rather than at a single location. When given areas share similar economic hardships, such as housing instability or unemployment, crime risk can spread across neighborhoods.
At the same time, geographic crime trends may reflect disparity in policing efforts and reporting practices across the city. Areas with greater police presence or enforcement initiatives record more incidents simply because there are more people to document crimes, even if actual crime levels are more similar to those in other parts of the city that go unreported.
One example of how policing practices can influence recorded crime patterns in Los Angeles was the aftermath of the Black Lives Matter protest in 2020. Large demonstrations took place all over the city, particularly in Downtown Los Angeles, Hollywood, and Fairfax, where thousands of protesters demanded police reform policymaking. The Los Angeles Police Department significantly increased police deployment in these areas to manage protests and maintain order (Chaleff, 2021). The increased patrols meant that officers were more likely to observe and document incidents occurring in these neighborhoods.
Taken together, the crime “hotspots” visible in Figure 2 suggest that crime in Los Angeles is shaped by both structural inequality and institutional practices. Crime incidences not only tend to concentrate in neighborhoods experiencing economic disadvantage and dense urban activity, but are also influenced by where law enforcement resources are deployed and where crimes are more likely to be documented. Understanding these geographic dynamics is essential for interpreting crime patterns in Los Angeles between 2021 and 2025, as both social inequality and changes in policing practices contributed to how crime was distributed and recorded across the city.
Offense 3: Crime Resolution Patterns across Crime Types

Figure 3: Percentage of criminal cases resolved by crime type (2021 vs. 2025)
Finally, we examined how case resolution rates differed across crime types between 2021 and 2025. Rather than merely measuring crime frequency, the visualization in Figure 3 shows the percentage of reported cases successfully resolved by law enforcement across offense categories, including assault, robbery, burglary, vehicle theft, and other theft or fraud offenses. This breakdown of resolution rates highlights how outcomes vary across crime types and how broader debates about policing, accountability, and public safety can influence which cases receive more attention and are ultimately resolved.
In 2021, near the end of the COVID-19 pandemic, violent crimes such as assault and robbery had the highest resolution rates, with about 42% of assault cases and 38% of robbery cases closed. At the same time, property-related crimes were resolved less frequently. For instance, only about 18% of burglary cases, about 25% cleared cases, and only about 15% of other theft/fraud cases were cleared. These differences reflect a clear pattern in criminal investigation. Violent crimes typically involve identifiable victims, witnesses, or suspects, which provide law enforcement with clearer leads and a simpler path to resolution than property crimes.
By 2025, the visualization shows a moderate rise in resolution rates across all crime types. Assault and robbery resolution increased by roughly 6% each. Property crimes had a smaller increase in resolution rates by approximately 4% each. Although these crimes still have lower clearance rates than violent offenses, the consistent increase across categories suggests a modest improvement in investigative outcomes over time. This consistent increase across crime categories suggests an improvement in investigative outcomes over time. However, it is important not to take these improvements as evidence that the criminal behavior changed or that investigative effectiveness alone improved.
For instance, research cautions that resolution rates are heavily shaped by the institutional priorities and administrative practices within law enforcement departments. Criminal researcher Jessie Slepicka argues that crime clearance statistics often reflect broader policing strategies, external incentives, and departmental performance metrics rather than purely shifts in criminal activity. Police departments are frequently under political pressure to show they are effectively addressing crime and keeping the public safe. This effectiveness is most commonly measured using crime statistics, such as arrests or case clearance (Slepicka, 2024). In early 2020, police departments across the nation faced political and social scrutiny, calling for police reform and increased accountability following the death of George Floyd. This outrage put stations like the LAPD under the political microscope. Therefore, under these conditions, the increase in reported resolution rates may partly reflect increased law enforcement efforts to demonstrate transparency and overall responsiveness to crime, especially violent cases.
Similarly, public trust and reporting behavior also shape which cases are part of resolution statistics. Research on crime reporting trends shows that victims’ willingness to report crimes is strongly influenced by their level of trust in law enforcement and their perceptions of police legitimacy (Xie et al., 2023). During this period, intense political debates over policing can strain relationships between communities and law enforcement, which inevitably influences both how many crimes are reported and which cases move forward in the investigative process.
Together, these patterns in Figure 3 illustrate that law enforcement resolved a slightly larger share of reported cases in 2025 than in 2021. More importantly, these trends highlight that resolution statistics are shaped not only by investigative outcomes but also by broader institutional and political factors in Los Angeles. Protests, social movements, and public debates about policing and accountability influence not only how crime occurs but also how it is reported, categorized, and recorded, showing how crime statistics reflect the social and political environment in which they are produced rather than simply changes in criminal behavior.
Conclusion: Narrative “Sets Bail”
Overall, the patterns observed in this report illustrate that crime trends in Los Angeles cannot be understood strictly through crime statistics. Crime statistics are shaped by both criminal behavior and the political narratives and institutional practices surrounding policing. The political context influences both how crime occurs and how willing individuals are to report incidents to law enforcement. In the aftermath of police brutality movements, protests, and media coverage of waves of crime in 2021, there were more factors involved in shaping victims’ decisions to contact law enforcement or not. As a result, public confidence and trust in law enforcement play a significant role in shaping crime statistics alongside criminal activity itself.
Institutional changes have also shaped how crime itself is recorded. The shift to a NIBRS-style system of crime reporting by the LAPD allowed multiple offenses to be recorded within a single incident (Rantala, 2000). This shift produced far more detailed records of crime investigators than earlier reporting systems.
Taken together, our analysis of crime severity, geographic patterns, and case resolution rates between 2021 and 2025 demonstrates that Los Angeles’ crime statistics are formed by the intersection of the political climate, policing practices, and social inequalities throughout the city. Rather than being neutral measures of crime, crime statistics are constantly shaped by the shifting political context in which they are produced.

Read Covid-19 Aftermath & Crime Severity
Explore how the global public health crises reshaped the geography and character of crime.